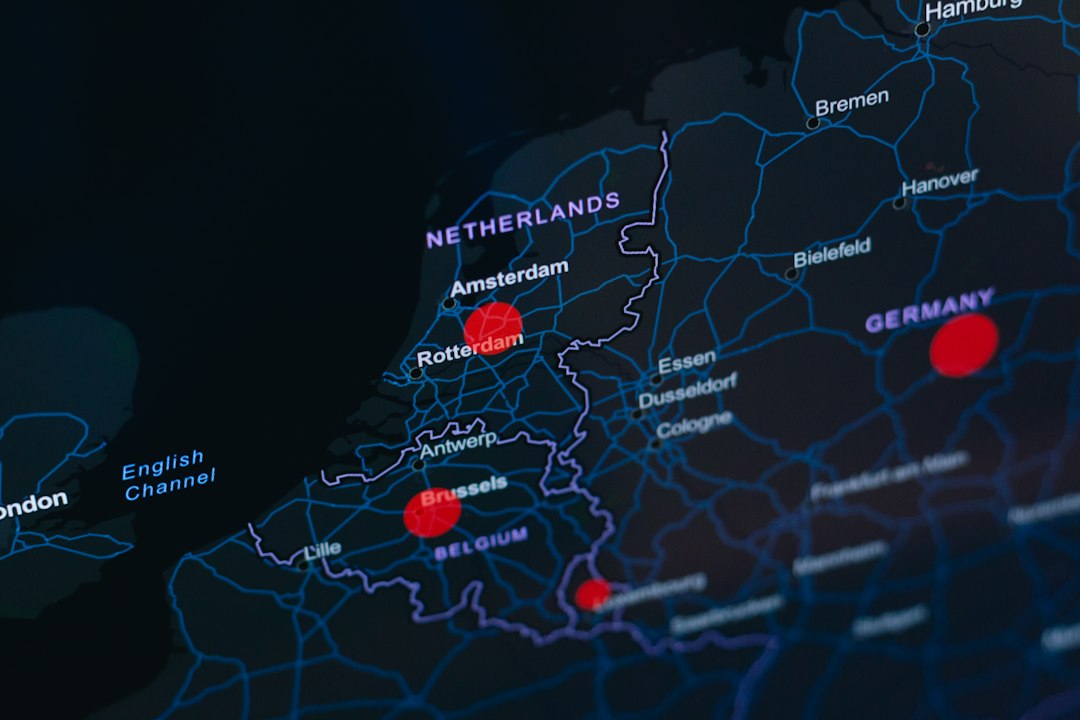
The dust motes danced in the late afternoon sun, illuminating the faded inks of ancient maps and fragments of papyrus. For centuries, scholars have painstakingly pieced together narratives of human movement, tracing the journeys of merchants, pilgrims, armies, and explorers. These tales, often rich with anecdotal detail, have provided invaluable insights into the economies, cultures, and political landscapes of bygone eras. However, the sheer volume of available historical data, coupled with the inherent limitations of traditional textual analysis, has often left vast swathes of ancient travel shrouded in mystery. The advent of data science, with its powerful tools for pattern recognition, visualization, and predictive modeling, is now poised to revolutionize our understanding of these historical voyages. By treating ancient travel as a complex network of interconnected nodes and edges, researchers are beginning to map the past in unprecedented detail, revealing the ebb and flow of human activity across continents and millennia. This burgeoning field, which can be broadly termed “visualizing ancient travel itineraries with data science,” promises to unlock new layers of historical interpretation, moving beyond singular narratives to a more holistic and dynamic understanding of past human mobility.
Unearthing the Data: Sources and Challenges
The foundation of any data science endeavor lies in the quality and accessibility of its source material. For the study of ancient travel, this material is as diverse as it is fragmented, presenting a unique set of challenges for data extraction and normalization. These sources range from the monumental to the mundane, each offering a distinct perspective on movement and interaction in the ancient world.
Written Records: Texts as Geographical Signposts
The most abundant source of information for ancient travel comes from written records. These include a vast array of documents, each requiring careful interpretation and often specialized knowledge to extract relevant geographical data.
Literary and Historical Accounts
Epic poems, historical chronicles, philosophical treatises, and letters often mention journeys, trade routes, and the movement of people. The Odyssey, for instance, is a foundational text detailing Odysseus’s long and arduous voyage home, replete with geographical references that have been the subject of scholarly debate for millennia. Herodotus’s Histories, similarly, provides detailed accounts of the Persian Empire’s vast road networks and the movements of armies and emissaries. These narratives, while often embellished, offer clues to the approximate locations of destinations, the duration of travel, and the modes of transportation employed.
Administrative and Economic Documents
Beyond grand narratives, more practical documents provide crucial insights. Roman tax records, for example, can reveal the movement of goods and the individuals responsible for their transport. Egyptian papyri from various periods often contain shipping manifests, toll records, and lists of travelers. These documents, while less engaging than epic poetry, offer a more grounded perspective on the logistical realities of ancient commerce and administration, frequently mentioning specific ports, river crossings, and distances.
Inscriptions and Epigraphy
Inscriptions carved into stone, whether on public monuments, funerary stelae, or personal grave markers, can offer evidence of individuals traveling to specific locations for trade, religious pilgrimage, or military service. Dedicatory inscriptions at sanctuaries, for instance, might mention offerings made by individuals from distant cities, implying a journey undertaken. Similarly, tomb inscriptions can sometimes indicate the place of origin of the deceased or their travels during their lifetime.
Archaeological Evidence: Traces in the Earth
Archaeology provides a tangible counterpoint to textual records, offering physical evidence of human presence and movement. The interpretation of these findings often requires integration with textual data to establish context and meaning.
Trade Goods and Provenance Analysis
The discovery of specific types of pottery, metalwork, or precious stones in archaeological contexts far from their presumed place of origin is a powerful indicator of trade routes and long-distance exchange. Techniques like X-ray fluorescence (XRF) and neutron activation analysis (NAA) can determine the chemical composition of artifacts, allowing researchers to trace their geological source. This allows for the reconstruction of complex trade networks, identifying key hubs and intermediaries.
Settlement Patterns and Infrastructure
The distribution of ancient settlements across a landscape, along with the discovery of roads, bridges, harbors, and waystations, directly speaks to patterns of movement and connectivity. Roman roads, for example, are not merely remnants of engineering prowess but are also explicit mapping of strategic and commercial arteries. The presence of a network of small settlements along a major river or coastline suggests regular travel and interaction between these communities.
Shipwrecks and Maritime Archaeology
Shipwrecks offer invaluable snapshots of maritime trade. The cargo found within a wreck can reveal the origin and destination of a voyage, the types of goods being transported, and the likely route taken. The analysis of ship construction itself can also provide information about seafaring capabilities and the technologies available for long-distance navigation.
The Data Science Toolkit: Transforming Fragments into Networks
The sheer heterogeneity and often incomplete nature of these sources present a significant hurdle. This is where data science methodologies become indispensable.
Data Extraction and Digitization
The first crucial step is the extraction of relevant information from diverse sources and its digitization into a structured format. This involves techniques such as optical character recognition (OCR) for ancient texts, manual data entry for fragmented inscriptions, and the creation of databases for archaeological findings. Natural Language Processing (NLP) techniques are increasingly employed to automatically identify place names, personal names, dates, and travel-related verbs within textual sources, significantly accelerating the process.
Georeferencing and Spatial Data Integration
A critical challenge is to accurately georeference the often-vague geographical references found in ancient texts. This involves identifying ancient place names with their modern or known ancient counterparts, a process that can be complex due to name changes, geographical shifts, and the imprecise nature of ancient cartography. Geographic Information Systems (GIS) are then used to overlay this georeferenced data onto historical and modern maps, creating spatial datasets that can be analyzed for patterns and correlations. Integrating data from different sources, such as textual mentions of a trade route and archaeological evidence of its use, requires sophisticated data fusion techniques.
Network Analysis and Graph Theory
Ancient travel can be effectively modeled as a network. Cities, ports, or significant geographical features become nodes, and the journeys or trade connections between them become edges. Graph theory provides the mathematical framework for analyzing these networks, identifying central hubs, bottlenecks, critical pathways, and the overall structure of connectivity. Algorithms like PageRank can identify the most influential locations within a travel network, while community detection algorithms can reveal clusters of interconnected regions.
Visualization Techniques: Bringing the Past to Life
Once the data is structured and analyzed, compelling visualizations are essential for communicating the findings. This is where the “visualizing” aspect of the field truly comes to the fore.
Static Maps and Temporal Overlays
Traditional static maps are enhanced with layers of data, showing the extent of known trade routes, the distribution of specific goods, or the migration patterns of certain populations. Temporal overlays can be used to demonstrate how these networks evolved over time, illustrating the rise and fall of particular routes or the impact of major historical events on travel patterns.
Dynamic Visualizations and Simulations
More advanced techniques involve creating dynamic visualizations that simulate the movement of people or goods through time. Animated maps can show the progression of a trade caravan, the spread of an epidemic along a travel route, or the ebb and flow of pilgrims visiting a sacred site. These simulations, often informed by quantitative models, can offer intuitive and engaging ways to understand complex historical processes.
In exploring the fascinating world of ancient travel itineraries, data science visualization plays a crucial role in understanding historical patterns and routes. A related article that delves into the discovery of artifacts that challenge our understanding of ancient civilizations can be found at this link. This piece highlights how such findings can provide context for the travel habits of ancient peoples, offering insights that enhance our visualizations and interpretations of historical data.
Reconstructing Ancient Arteries: Trade Routes and Commerce
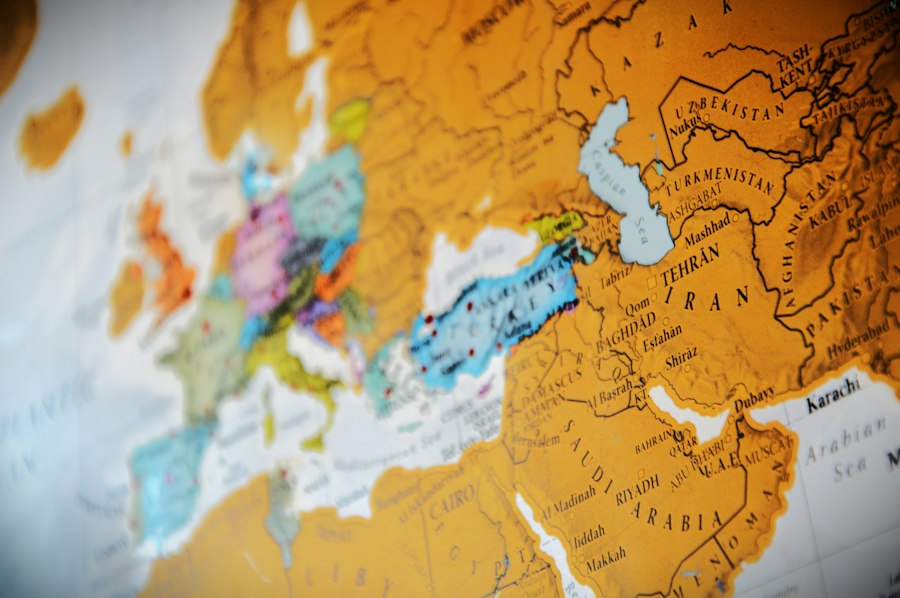
The meticulous study of ancient trade routes offers a compelling case study for the application of data science in visualizing historical travel itineraries. These arteries of commerce were not merely passive conduits but were dynamic systems that shaped economies, facilitated cultural exchange, and influenced the geopolitical landscape of the ancient world. Data science provides the tools to move beyond anecdotal accounts of exotic goods and reconstruct the intricate networks that sustained these ancient economies.
Mapping the Flow of Goods: From Source to Market
The journey of a single commodity, from its point of origin to its final destination, can reveal a wealth of information about ancient travel. By aggregating data on the provenance of trade goods and their distribution in various archaeological contexts, researchers can begin to map the invisible threads of ancient commerce.
Commodity-Specific Network Analysis
By focusing on specific commodities – be it Roman wine amphorae found in Britain, Egyptian grain reaching the Levant, or Chinese silk appearing in the Roman Empire – researchers can construct dedicated network maps. These maps highlight the primary production zones, the key transit points, and the ultimate consumer markets. For instance, analyzing the distribution of amphorae from different Italian regions can reveal distinct export networks, with some amphorae traveling north along the coast and others heading east across the Mediterranean. This granular analysis allows for the identification of specialized trade routes tailored to particular goods.
Identifying Key Hubs and Intermediaries
Network analysis is instrumental in identifying the most significant trading hubs – cities, ports, or caravanserai – that served as nodes for the exchange of goods. These hubs often possess a high degree of connectivity, linking multiple production zones with diverse consumption areas. Data science can quantitatively assess the centrality of these locations within the broader trade network, revealing their economic importance and the volume of goods they processed. Furthermore, these analyses can help identify intermediary centers, places where goods were consolidated, repackaged, and transferred to different carriers, adding another layer of complexity to the understanding of ancient supply chains.
Estimating Trade Volumes and Economic Impact
While precise quantification of ancient trade volumes is inherently challenging, data science offers methods for making informed estimations. By combining archaeological evidence of artifact prevalence with textual references to quantities and prices, statistical models can be developed. Analyzing the density of specific trade goods in different settlements can provide relative indicators of consumption and, by extension, the volume of trade that passed through those locations. This allows for a more nuanced understanding of the economic impact of trade on different regions and the development of specialized economies.
Maritime and Overland Networks: A Comparative Perspective
The ancient world relied on both sea and land routes for trade, each with its own distinct characteristics, challenges, and networks. Data science can help to disentangle these interwoven systems and understand their relative importance.
Analyzing Maritime Routes and Shipping Patterns
The analysis of shipwrecks, port infrastructure, and textual accounts of seafaring provides the basis for reconstructing ancient maritime routes. GIS can be used to map the most probable sea lanes, taking into account prevailing winds, currents, and prevailing navigational practices. Analyzing the distribution of shipwrecks across the Mediterranean, for example, can reveal common voyage paths and the locations of known hazards. The cargo within these wrecks further informs the types of goods being transported by sea and the destinations they were destined for.
Visualizing Overland Journeys and Caravan Routes
Overland travel, often facilitated by caravans, presented its own set of challenges and required extensive infrastructure, including roads, bridges, and wells. By georeferencing textual descriptions of routes, identifying known road networks (such as Roman roads), and analyzing the distribution of archaeological sites that served as waystations, researchers can map these terrestrial arteries. The movement of goods like spices, metals, and textiles overland can be tracked, revealing the connectivity between inland settlements and coastal ports. The visualization of these routes can highlight their strategic importance in connecting distant regions and facilitating long-distance exchange.
The Interplay of Sea and Land: Multimodal Trade
Many ancient trade networks were multimodal, involving the transfer of goods between sea and land routes. Data science can help to visualize and analyze these complex interconnections. By mapping both maritime and overland routes and identifying the points where they converged (major port cities or riverine hubs), researchers can understand how goods transitioned between different modes of transport. This integration reveals the efficiency and resilience of ancient trade systems, highlighting how different networks complemented each other to facilitate the movement of goods across vast distances.
The Wanderer’s Path: Pilgrimage, Migration, and Movement
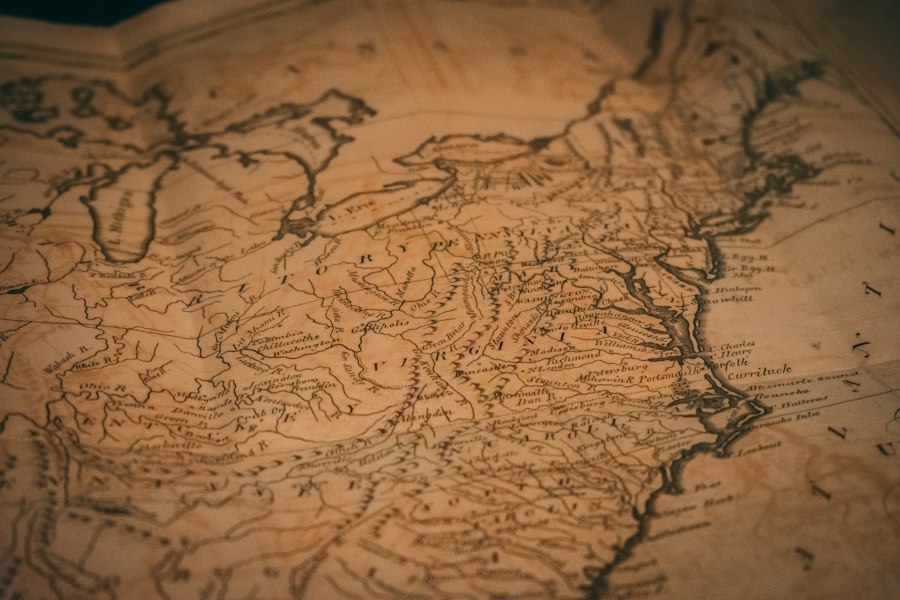
Beyond the realm of commerce, ancient populations were on the move for a myriad of other reasons: spiritual devotion, seeking new opportunities, fleeing conflict, or simply exploring the known world. Visualizing these journeys offers a profound insight into the social fabric, religious beliefs, and demographic dynamics of antiquity. Data science provides powerful tools to illuminate these often-personal narratives on a larger scale.
Mapping Devotion: The Journeys of Pilgrims
Religious pilgrimage was a significant driver of travel in the ancient world, with individuals undertaking arduous journeys to sacred sites, temples, and shrines. The analysis of inscriptions, votive offerings, and textual accounts can reveal the geographic reach of these devotional networks.
Tracing the Footsteps to Sacred Sites
By cataloging dedications made by individuals from distant locations at pilgrimage centers like Delphi, Olympia, or the temples of Egypt, researchers can map the origins of pilgrims. GIS analysis can then be used to plot the most probable routes taken from these homelands to the sacred destination. The density of pilgrims from specific regions can reveal the relative popularity of certain cults and the influence of religious centers.
Analyzing the Spread of Religious Ideas and Practices
The movement of pilgrims was not just a physical journey; it was also a conduit for the dissemination of religious ideas, rituals, and artistic styles. By studying the provenance of artifacts found at pilgrimage sites that originated from distant regions, or the adoption of architectural styles at satellite shrines, data science can help to visualize how religious practices spread and evolved through these movements. This allows for an understanding of the cultural impact of pilgrimage beyond the purely devotional aspect.
The Great Relocations: Migration and Displacement
Throughout antiquity, populations migrated for various reasons, including climate change, resource scarcity, political instability, or the promise of a better life. These movements, often large-scale and transformative, shaped the demographic landscape of continents.
Reconstructing Migration Waves and Patterns
Archaeological evidence, combined with textual records and, where available, ancient DNA analysis, can be used to reconstruct migration waves. By mapping the distribution of specific cultural markers, technologies, or settlement patterns that appear in new regions, researchers can infer the direction and scale of migrations. Data science techniques can help to identify clusters of evidence suggestive of a coherent migratory movement and to estimate the timing and duration of these relocations.
Understanding the Impact of Displacement and Colonization
The forced displacement of populations due to conflict or conquest, and the subsequent colonization of new territories, are crucial aspects of ancient history. Visualizing these movements involves mapping the areas of origin of displaced groups and their resettlement locations. Analyzing the integration (or lack thereof) of migrating populations into existing societies, often through the study of material culture and linguistic evidence, can be facilitated by data science approaches. This allows for a more nuanced understanding of the social and cultural transformations that resulted from ancient migrations.
The Explorer’s Itinerary: Early Exploration and Discovery
While often intertwined with trade and migration, there were also instances of deliberate exploration of the unknown. These journeys, though perhaps less frequent, pushed the boundaries of the known world and expanded geographical understanding.
Mapping Known and Unknown Territories
By analyzing ancient maps, travelers’ accounts, and descriptions of geographical features, researchers can attempt to reconstruct the perceived boundaries of the known world at different periods. Data science can help to identify inconsistencies and gaps in these perceptions, highlighting areas that remained unexplored or were known only through hearsay.
The Voyages of Discovery: Evidence and Inference
The voyages of figures like Pytheas of Massalia to the far north or the expeditions commissioned by rulers to explore distant lands can be pieced together from fragmented sources. Data science can assist in analyzing the geographical references in these accounts, triangulating possible routes, and assessing the plausibility of their claims. The visualization of these early exploratory journeys can reveal the progressive expansion of geographical knowledge and the gradual mapping of the ancient world.
The Personal Journey: Individual Itineraries and Social Networks
While grand narratives of trade and migration are crucial, the true richness of ancient travel lies in the individual experiences and the intricate web of social connections that facilitated these journeys. Data science, by moving beyond aggregate data, can also shed light on the personal itineraries of individuals and the social networks that underpinned their movements.
Reconstructing Individual Itineraries: The Power of Biography
The lives of specific individuals, particularly those from elite backgrounds or those who left extensive written records, can provide detailed accounts of their travels. Data science can be used to meticulously extract and synthesize this information to reconstruct their personal itineraries.
Extracting Biographical Data from Texts
Literary biographies, autobiographical inscriptions, letters, and legal documents can all contain valuable information about an individual’s movements. NLP techniques can be employed to identify mentions of locations visited, the purpose of the journey, the duration, and the companions. For example, the letters of Cicero offer a detailed account of his travels within the Roman Republic and his periods of exile, providing a rich dataset for reconstructing his personal itinerary.
Visualizing Personal Travel Diaries and Letters
Once extracted, this biographical data can be visualized in novel ways. Animated timelines can illustrate the progression of an individual’s journeys throughout their life, while GIS can map the specific routes taken. Connecting these personal journeys to broader historical events or trade networks can provide a more contextualized understanding of their significance. The visualization of a philosopher traveling between academic centers or a merchant navigating trade routes offers a human-scale perspective on ancient mobility.
The Fabric of Connection: Social Networks and Travel Facilitation
Ancient travel was rarely undertaken in isolation. Individuals relied on pre-existing social networks, familial ties, patron-client relationships, and professional guilds to facilitate their journeys. Data science can help to map these intricate webs of connection.
Identifying Relationships and Patronage
By analyzing texts that describe relationships between individuals – be it political alliances, familial bonds, or patronage relationships – researchers can infer how these connections might have influenced travel. For instance, a patron might have provided letters of introduction, financial support, or safe passage for a client undertaking a journey. Identifying these relational links can help explain why certain individuals traveled to specific locations or had access to particular resources.
The Role of Guilds and Professional Networks
Ancient guilds and professional associations played a significant role in organizing and facilitating travel for their members. Merchants’ guilds, for example, might have established fixed routes, provided shared accommodation, and offered mutual support to travelers. By analyzing textual evidence of such organizations and their activities, data science can help to map the specialized travel networks that supported particular professions and industries. The visualization of these networks can reveal how collective action and mutual trust enabled long-distance movement.
Visualizing Reciprocal Networks and Communication Channels
The analysis of correspondence and mentions of intermediaries can help to map the flow of information and the establishment of communication channels that underpinned travel. Individuals relied on networks of trusted contacts to relay messages, arrange meetings, and provide logistical support. Visualizing these reciprocal networks can highlight the importance of social capital in enabling and sustaining ancient travel, moving beyond the purely economic or political motivations.
In exploring the fascinating world of ancient travel itineraries, data science visualization plays a crucial role in uncovering patterns and insights that were previously hidden. By analyzing historical routes and destinations, researchers can better understand the movement of people and goods in ancient times. A related article that delves into the intersection of ancient technology and modern analysis can be found at this link, which highlights how innovative techniques are being used to reveal the complexities of ancient civilizations.
The Future of Historical Visualization: Beyond Static Maps
| Itinerary Name | Region | Time Period | Number of Stops | Average Distance Between Stops (km) | Primary Mode of Travel | Data Source | Visualization Type |
|---|---|---|---|---|---|---|---|
| Silk Road Caravan Route | Central Asia | 2nd Century BCE – 14th Century CE | 25 | 150 | Camels | Historical Texts, Archaeological Records | Network Graph, Heatmap |
| Roman Empire Road Network | Europe | 1st Century BCE – 4th Century CE | 40 | 30 | Horse-drawn Carriages, Walking | Ancient Maps, Itineraria | Geospatial Map, Timeline |
| Incense Route | Middle East | 3rd Century BCE – 2nd Century CE | 15 | 80 | Camels | Trade Records, Inscriptions | Flow Diagram, Bar Chart |
| Viking Exploration Routes | Scandinavia to North Atlantic | 8th – 11th Century CE | 10 | 200 | Longships | Sagas, Archaeological Finds | Route Map, Timeline |
| Ancient Egyptian Trade Routes | Nile Valley | 3rd Millennium BCE – 1st Millennium BCE | 12 | 50 | Boats, Walking | Papyri, Tomb Paintings | Geospatial Map, Sankey Diagram |
The application of data science to the study of ancient travel itineraries is not merely about creating more detailed maps; it is about fundamentally transforming how we understand and interact with the past. This evolving field promises to unlock new historical narratives and provide a more dynamic and nuanced perspective on human history.
Predictive Modeling and Scenario Exploration
As datasets grow and analytical models become more sophisticated, the potential for predictive modeling emerges. By understanding the factors that influenced historical travel – such as economic incentives, political stability, environmental conditions, and existing infrastructure – researchers can begin to model plausible future travel scenarios in ancient contexts.
Simulating Unrecorded Journeys
While the goal is to reconstruct what did happen, data science can also help to explore what could have happened. By analyzing the density of existing networks, the accessibility of resources, and the known motivations for travel, predictive models could simulate potential, but unrecorded, journeys. This could help to fill gaps in our understanding and generate new hypotheses for archaeological investigation.
Assessing the Impact of Historical Events
Data science can be used to model the ripple effects of major historical events on travel patterns. For instance, a war or a natural disaster could be simulated within a travel network to predict how it might have disrupted trade routes, triggered migrations, or altered pilgrimage patterns. This allows for a more dynamic understanding of cause and effect in history.
Interactive and Immersive Data Exploration
The future of visualizing ancient travel lies in creating interactive and immersive experiences that allow users to explore historical data in a more engaging and intuitive way.
Dynamic and User-Driven Visualizations
Moving beyond static maps, future visualizations will likely be dynamic, allowing users to control the temporal aspect, zoom in on specific regions or individuals, and filter data based on their interests. This will empower a wider audience to engage with historical research and discover new insights.
Virtual and Augmented Reality Applications
The integration of virtual reality (VR) and augmented reality (AR) technologies offers the tantalizing prospect of “walking” through ancient travel itineraries. Imagine virtually traversing a Roman road, exploring the bustling marketplace of an ancient city, or witnessing a caravan embark on a long journey. These immersive experiences could revolutionize historical education and public engagement with the past.
Ethical Considerations and the Future of Historical Interpretation
As data science becomes increasingly integrated into historical research, it is crucial to consider the ethical implications.
Bias in Data and Algorithmic Interpretation
The data used to reconstruct ancient travel is often incomplete and subject to historical biases. It is essential to be transparent about the limitations of the data and the potential for algorithms to perpetuate or even amplify these biases. Critical evaluation of the data and the models used is paramount.
The Democratization of Historical Research
Data science has the potential to democratize historical research, making complex analyses accessible to a broader range of scholars and enthusiasts. However, it also raises questions about the need for interdisciplinary collaboration and the importance of humanistic interpretation to complement quantitative analysis. The goal is to enhance, not replace, traditional historical scholarship.
The journey of data science into the study of ancient travel is still in its early stages, but its potential is immense. By meticulously unearthing, analyzing, and visualizing the remnants of past journeys, researchers are not only recreating the routes of our ancestors but also gaining a profound understanding of the forces that shaped human civilization. The intricate tapestry of ancient movement, once fragmented and elusive, is gradually being illuminated, offering us a more comprehensive and compelling portrait of our shared human past.
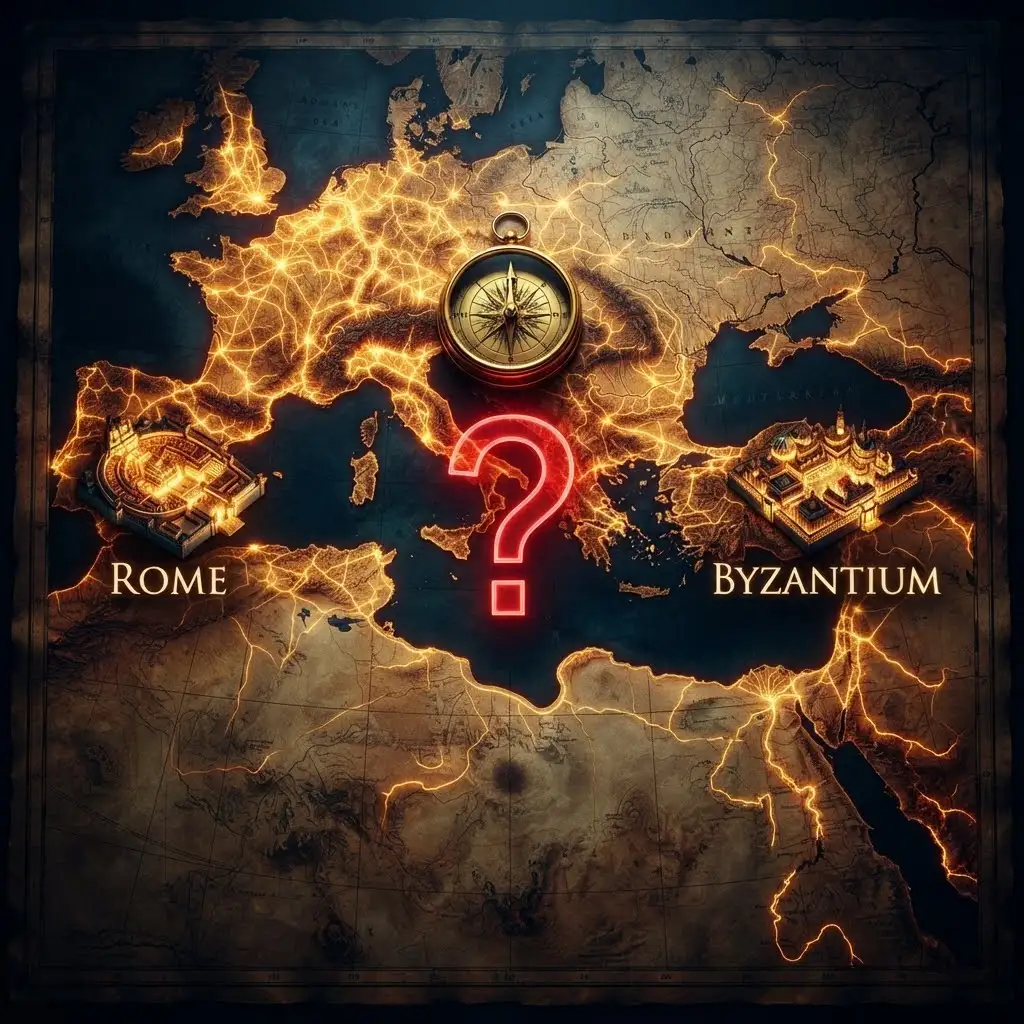
The 2.7% Statistic That Terrifies Roman Historians
FAQs
What is the significance of ancient travel itineraries in data science visualization?
Ancient travel itineraries provide valuable historical data that can be analyzed and visualized using data science techniques to gain insights into past civilizations, trade routes, and cultural exchanges.
How can data science visualization help in understanding ancient travel patterns?
Data science visualization techniques can help in mapping out ancient travel routes, identifying common destinations, analyzing travel durations, and uncovering patterns in historical travel behaviors.
What types of data are typically used in visualizing ancient travel itineraries?
Common types of data used in visualizing ancient travel itineraries include historical texts, archaeological findings, geographical coordinates, ancient maps, and inscriptions on monuments or artifacts.
What are some challenges in visualizing ancient travel itineraries using data science?
Challenges in visualizing ancient travel itineraries include incomplete or fragmented historical records, deciphering ancient languages or scripts, accurately geolocating ancient sites, and accounting for changes in geography over time.
How can data science visualization of ancient travel itineraries benefit researchers and historians?
Data science visualization of ancient travel itineraries can help researchers and historians gain new perspectives on ancient civilizations, trade networks, cultural interactions, and technological advancements, leading to a deeper understanding of the past.